


“We have a really strong following.”
Great. Do they buy tickets? Where do they live? How old are they? How far will they travel? When do they buy? And can you prove it?
Because followers are not a target market. A tribute show needs several hundred people in one geographic area to choose your show, your venue, your date — and pay for it. That makes knowing exactly who buys your tickets one of the most valuable assets your music brand can own.
Most tribute shows are pitching venues with photographs, posters, biographies and a showreel. But imagine adding:
Our primary ticket buyer is 45–64. Sixty-eight per cent of our previous buyers came from within 30 kilometres of the venue. Facebook generated the highest-converting traffic. Forty-two per cent of tickets were purchased in the final ten days. Our strongest secondary market is women aged 35–44.
Now we are having a completely different conversation with the prospective pub or club who wants to book your show. It’s not just about what happens on stage but who is likely to be standing in front of it.
Let us kill off one particularly persistent piece of music-industry mythology.
10,000 followers does not mean 10,000 customers.
For a promoter, club, hotel, theatre or entertainment venue, the valuable questions are: Who buys? Where do they live? How much will they pay? How far will they travel? How early do they buy? What makes them click? And where can we find more people like them?
That is your Target Demographic Data.
Music brands presenting tribute shows have something original artists don’t always have. A pre-existing cultural market. The audience already knows Queen, Fleetwood Mac, ABBA, Pink Floyd, INXS, Taylor Swift, Elvis, Cold Chisel and whatever artist, catalogue or era your show celebrates.
Your task isn’t to convince somebody that the music is good. The original artist already did that. Your commercial job is to identify which part of that enormous fan universe is most likely to buy your particular live experience, in this particular market, at this particular price.
And did you know that Eventbrite’s Australian 2026 trends research reported that paid tickets for retro-decade events celebrating the 60s, 70s, 80s and 90s increased 8.5% in 2025? It also reported that 64% of organisers believed consumers would seek more niche events in 2027.
Step One - the ticket buyer. Not likes, views, follows or shares. Credit Card or Cash transactions.
So make it a habit, after every ticketed show, ask the promoter, venue or ticketing company for whatever aggregated sales information they can legitimately provide. At a minimum, establish:
tickets sold
venue capacity
average ticket price
buyer postcode or geographic area
sales timeline
ticket type
referral or campaign source where available
buyer demographic information where legitimately collected and shareable.
Ticketing systems increasingly provide exactly this kind of intelligence to analyse attendee location, promotional channels, ticket types, traffic and conversion, and export event reports. And postcode information can become incredibly powerful.
Suppose you discover this after five Queensland performances:
EXAMPLE — WHERE OUR BUYERS COME FROM
Brisbane / Inner Metro
████████████████████████████ 42%
Outer Metro
██████████████████ 27%
Regional within 100km
██████████ 16%
100km+
██████ 9%
Other
████ 6%
Illustrative example — replace with your actual ticketing data.
Suddenly you know something commercially useful. Your show doesn’t merely have “Brisbane fans”. It has a measurable catchment area. And that gives the next promoter somewhere sensible to spend advertising money. Calculating your pulling radius is one of the best stats a tribute show can develop.
If you start to plot buyer postcodes against each venue, over time you may discover:
72% of our ticket buyers typically come from within 35km of the performance venue.
Or:
Regional performances regularly attract approximately 20% of buyers from more than 50km away.
Those are two very different products. One is strongly local. The other may have genuine destination-event potential. Neither is inherently better.
Knowing which one you are selling is the valuable bit.
Step Two - Your next job is to build an age profile. Don’t assume that because you perform 1980s music, your audience consists exclusively of people who were teenagers in 1985. Music travels through generations. Parents introduce children. TikTok resurrects old catalogues. Films and television create new audiences. Fashion recycles eras. A younger audience may experience your catalogue as nostalgia for a period they never actually lived through.
So measure it.
EXAMPLE — TICKET BUYERS BY AGE
18–24
████ 6%
25–34
███████ 11%
35–44
████████████ 19%
45–54
██████████████████████ 34%
55–64
████████████████ 25%
65+
███ 5%
Illustrative data only.
Now the venue knows something extremely important. This is primarily a 45–64 market. That affects everything from advertising channels to imagery, media buying, database segmentation, ticket pricing, food and beverage strategy and even what time the performance should start.
Step Three - Gender data can expose purchasing patterns.
Perhaps your audience is 61% women / 37% men / 2% other or undisclosed.
Useful. But the next question is more interesting. Who is actually initiating the purchase?
One person buying six tickets is commercially different from six people buying individually. That person may be the group’s social organiser. Find her — or him — and you’ve potentially found the most important customer in your entire marketing funnel.
The useful metric isn’t: Women like our show. It is: Women aged 45–59 represent our strongest purchasing cohort and frequently purchase multiple tickets per transaction.
Now a promoter can build a campaign around group behaviour, not crude demographic stereotypes.
Step Four - Find out when they buy.
This is another number promoters need. Track ticket sales from announcement to show day. Your curve might look something like this:
EXAMPLE — WHEN TICKETS SELL
First 48 hours
███████████████ 24%
Middle campaign
██████████████████████ 36%
Final 14 days
████████████████ 26%
Final 72 hours
█████████ 14%
Illustrative example.
Now compare that pattern across ten performances. You may discover that your audience has one of these three drivers - announcement driven, early-planning driven or last-minute driven.
If 40% of your market habitually buys in the final fortnight, a promoter shouldn’t panic six weeks out and start discounting the bloody thing into oblivion. Your historical data may be telling them. “Your buyers simply haven’t arrived yet.”
Step Five – Review your Digital Brand Touchpoints.
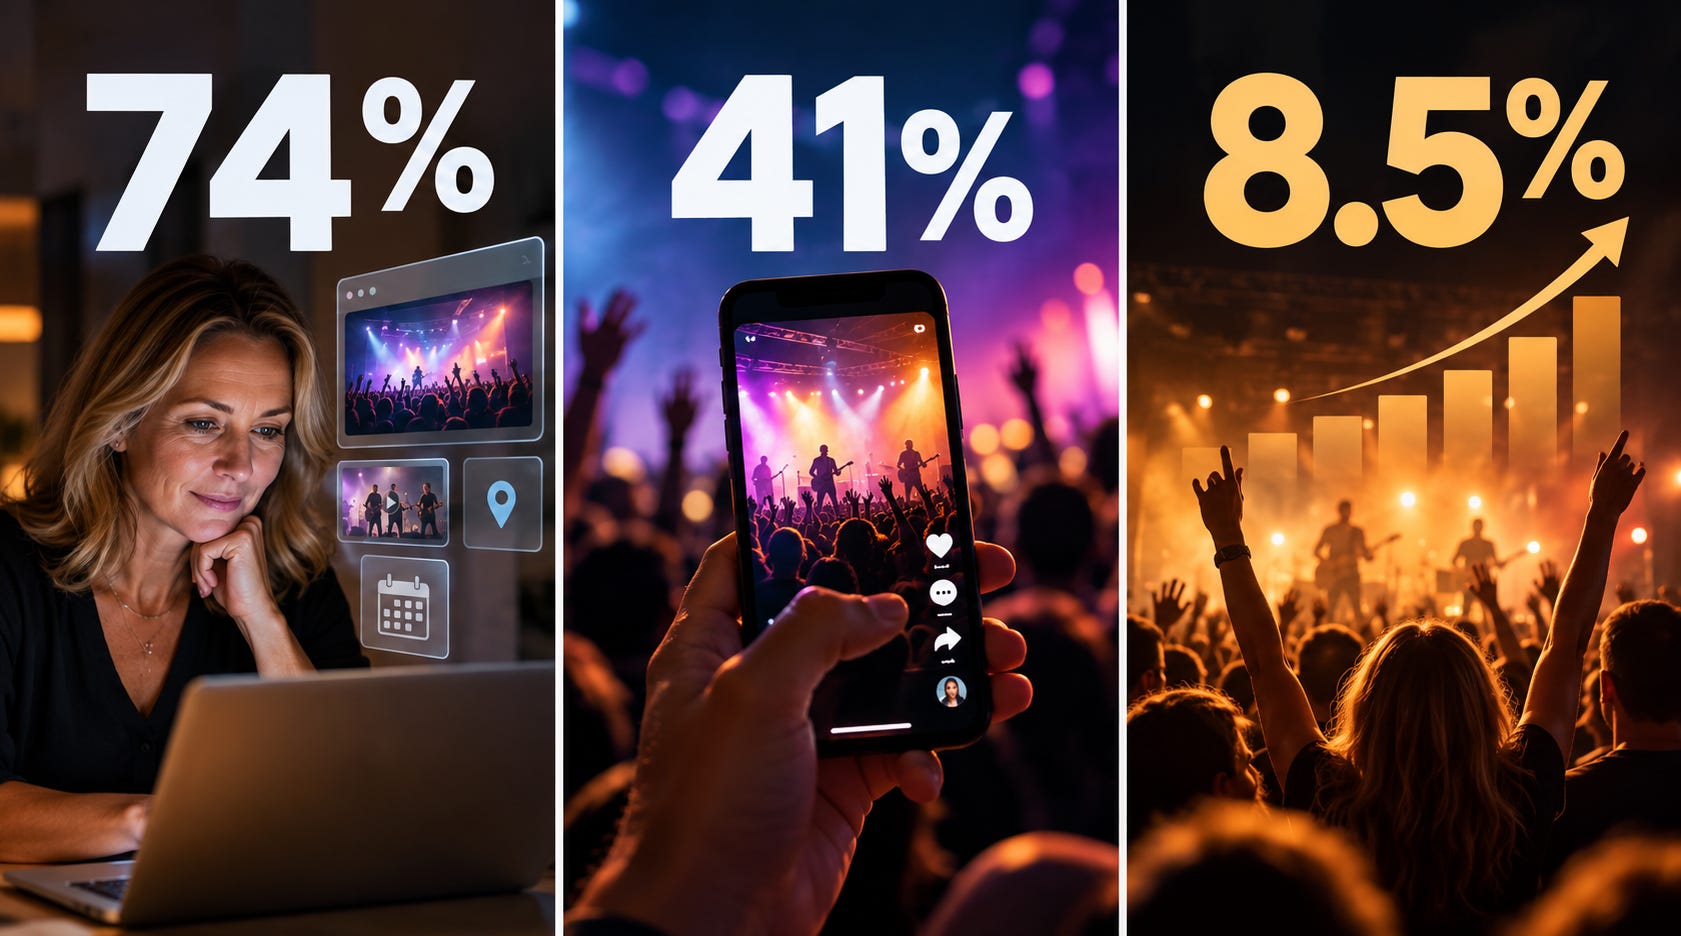
Why? The Aussie consumer is researching before they buy. Eventbrite’s Australian music-fan research found 74% of music-goers actively researched an event before purchasing a ticket. The information they most commonly sought included the event date, ticket price and venue. Social media was also important for discovery: 41% said social media was where they heard about music events, followed by word of mouth at 22% and direct email from promoters, artists or organisers at 11%.
That research is older — 2019 — so factor that into today’s definitive Australian market profile because the behavioural principle remains useful. Discovery and purchase are not necessarily the same event. Someone may see your Facebook ad. Google the show. Watch your YouTube showreel. Return to your website. Talk to friends. Then buy four tickets three days later.
Your job is to understand that journey.
Step Six - Set up your Website as an Intelligence Centre.
Install Google Analytics 4. Not because Google Analytics will magically identify every human who visits your website. It won’t. Privacy controls, consent settings and reporting thresholds mean demographic information can be incomplete. Google specifically applies thresholds to demographic reporting where small datasets could risk identifying individuals. But GA4 can still help you understand:
geographic location
acquisition channels
landing pages
returning visitors
devices
campaign performance
events
outbound ticket-link clicks
user journeys.
Most importantly, configure an event for BUY TICKETS, and then track it.
Step Seven – Set up your Tracking Links.
Instead of posting the identical ticketing URL everywhere, use trackable campaign links. Create separate URLs for:
Facebook
Instagram
TikTok
YouTube
Email
Venue website
Artist website
QR posters
Google advertising
Local media.
Now you can begin answering, “What actually sends people towards the ticket purchase?”
Eventbrite, for example, offers traffic/conversion and tracking-link reporting specifically designed to show which channels and links are generating event traffic and registrations. There is a huge difference between Facebook-generated 48,000 impressions. and Facebook generated 62% of tracked ticket-page traffic.
The first number sounds big. The second helps somebody make a decision.
Step Eight - Know your Facebook and Instagram Audience
Meta Business Suite can help you understand your social audience and content performance. Look for patterns in:
age cohorts
location
reach
engagement
video performance
link clicks
content format.
But don’t automatically declare Facebook your “main market” because that’s where you have the most followers. Compare social behaviour against ticket behaviour. If Facebook contains 70% of your followers but Instagram produces more ticket-link traffic, that’s useful. If neither converts, but your venue’s email database sells half the room? That’s even more useful.
The objective isn’t to prove that your social media strategy is brilliant. The objective is to discover what is true.
Step Nine - Know your Tik Tok Audience
TikTok can expose your show to younger audiences and generate extraordinary reach. Great. Track it. But don’t confuse discovery with commercial conversion. A 21-year-old watching 15 seconds of your Fleetwood Mac tribute is not automatically equivalent to a 52-year-old purchasing four $69 tickets. Both matter. They occupy different positions in the funnel. So record:
Views → Profile Visits → Link Clicks → Ticket Page → Purchase
The closer somebody moves towards the right-hand side, the more commercially valuable the behaviour becomes.
Step Ten - Spend some quality time in your You Tube Channel.
For tribute shows, YouTube may be your secret weapon. Why? Because audiences want proof. “Can these people actually deliver the experience I think I’m buying?” Your showreel answers that.
YouTube Analytics can show audience age, gender, country or region, watch behaviour, new versus returning viewers and other audience information, although Google warns that some demographic and geographic data may be limited where there isn’t sufficient data.
Pay particular attention to: Top Geographies and Watch Time. A thousand people watching three seconds isn’t particularly exciting. Four hundred people in your target market watching most of a three-minute live showreel? Now you’ve got my attention.
Step Eleven - Build your Audience Profile over Time
One performance gives you information. Ten performances give you patterns. Thirty performances give you business intelligence. That is why you need to record this information after every show. Your spreadsheet should eventually tell you:
THE AUDIENCE
Primary age
Secondary age
Gender composition
Group purchasing behaviour
THE GEOGRAPHY
Top suburbs
Top postcodes
Typical travelling distance
Regional versus metropolitan differences
THE PURCHASE
Average ticket price
Tickets per transaction
Sales velocity
Launch-period sales
Final-14-day sales
Final-72-hour sales
THE DISCOVERY
Facebook
Instagram
TikTok
YouTube
Google
Email
Venue database
Word of mouth
THE DIGITAL INTENT
Website visitors
Showreel views
Watch time
Ticket-link clicks
Click-through rate
Campaign conversion
THE RESULT
Capacity
Tickets sold
Sell-through percentage
Gross ticket revenue
Average ticket yield.
That is your audience asset that we pitch to the market to sell your show.
Step Twelve - Create your Demographic Cheat Sheet
Turn all that information into one page like this.
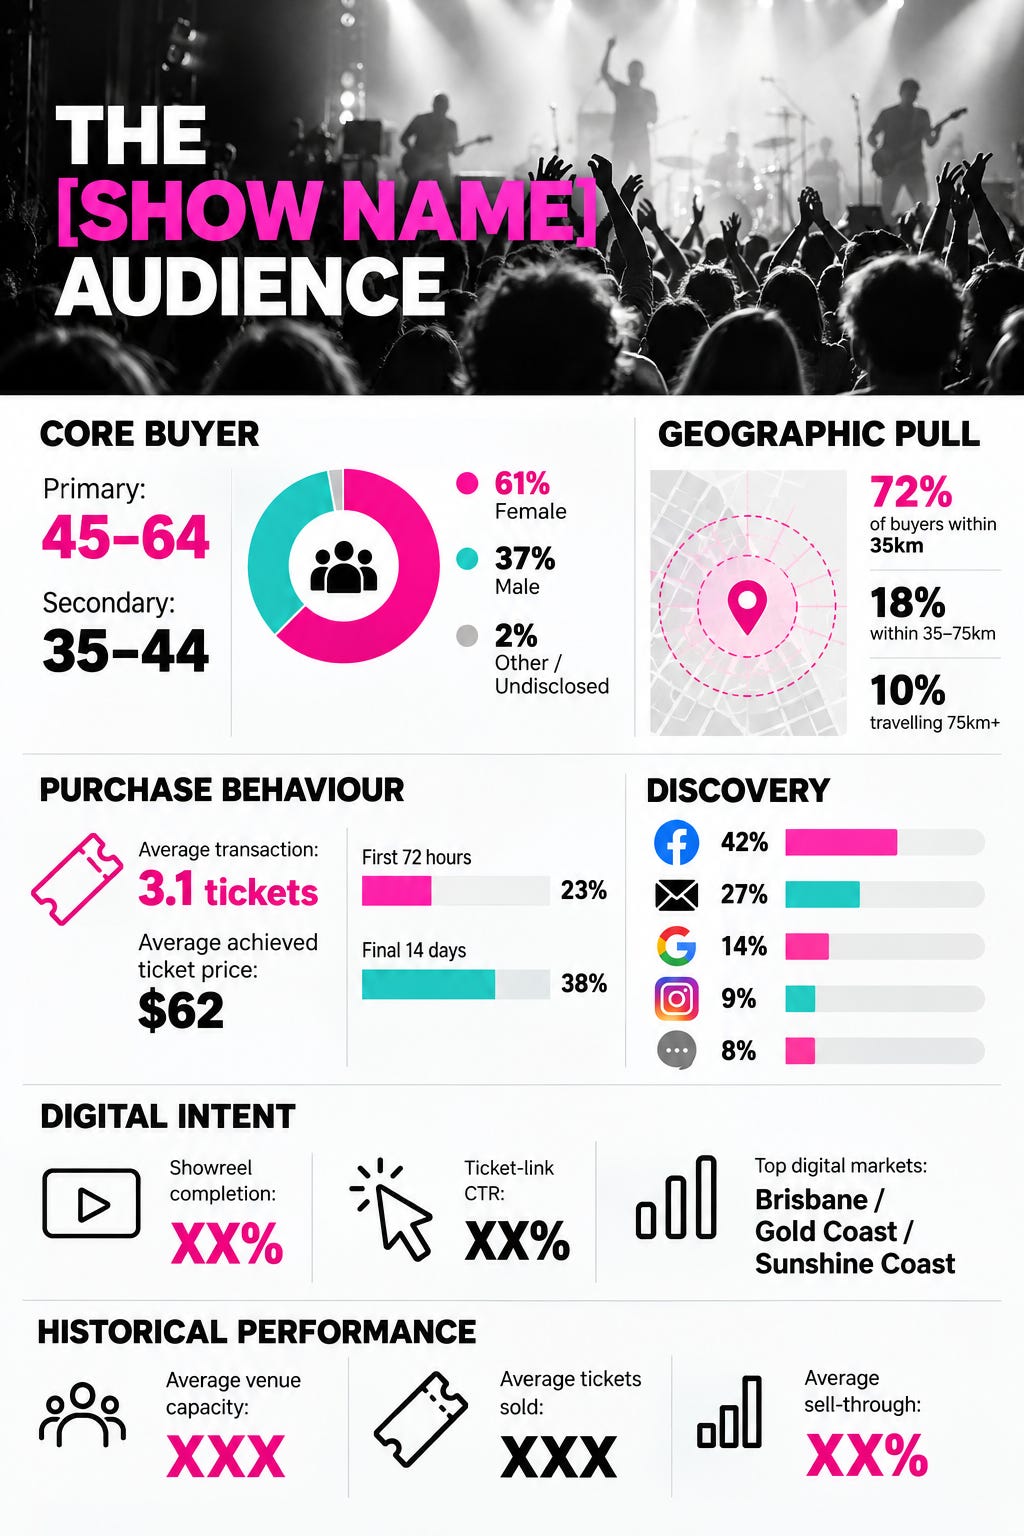
And make sure you don’t cherry-pick the numbers. Don’t manipulate your numbers to make the pitch prettier. Use them to make the business smarter. Data is useful precisely because it occasionally tells you something you don’t want to hear. Perhaps you thought your market was 35–44. It’s actually 55–64. Perhaps you’ve spent thousands building Instagram while 67% of attributable sales are coming from venue email databases. Perhaps your regional shows outperform metropolitan shows. Now you know.
Once you have established your Demographic Cheat Sheet, it may be time to retire the old Show Pitch for something that says:
This is the show.
This is the experience.
This is who buys it.
This is where they live.
This is what they pay.
This is when they buy.
This is where we find them.
This is what has happened in comparable markets.
And this is how we recommend we sell your room.
You’re no longer walking into the market asking, “Please book our show.” You are walking in saying, “Here is the audience opportunity.”
Nichola Burton has spent more than three decades in Australia’s live music industry, connecting artists, venues and audiences. Through Musoverse, she cuts through the mythology of the music business to explore what actually builds a sustainable music brand — understanding your market, creating value and turning an audience into a business.
